When we launched our Insights Academy a few years ago, our main goal in these events was to inspire new ways to look at the data and share skills and recommendations. In our recent Foodservice Insights Academy, we put our heads together to tackle one of the most frequently asked business questions: What is driving my category growth or decline?
In this post we share our recommended approach on where to start diving into the data.
Step 1: When
YoY and Quarterly Comparisons
Using week ending dates and weekly parameters, you can easily look at specific timeframes to highlight underlying shifts in consumer preferences. 52-week, 12-week and 4-week period comparisons are preset in the dynamic Discovery Tools, Dashboards and Analysis Tool template for quick reference.
Example: Is this growth or decline visible YoY or is it more short term?
Dimension to use: WHEN – Week Ending


Seasons and Events
You can use this dimension to highlight where seasons, bank holidays, sporting events or special days in the calendar have impacted a certain category. By cross checking with historical weather reports or travel news, we can build a picture of what other factors may have encouraged or prevented consumers from engaging in the market.
Example: Were consumers more engaged in your category in the 2024/25 Christmas and New Year period compared to that of 2023/24?
Dimension to use: WHEN – Seasons and Events


Day of the week
Use this simple dimension to find patterns in consumer behaviour, in order to identify where opportunities lie.
Example: Has hybrid working changed consumer preferences or needs in your category?
Eating & Drinking Out Panel Dimension to use: WHEN – Timeframe
Convenience Tracking Programme Dimension to use: WHEN – Day of Week
Step 2: Who
Age, Gender, Social Grade
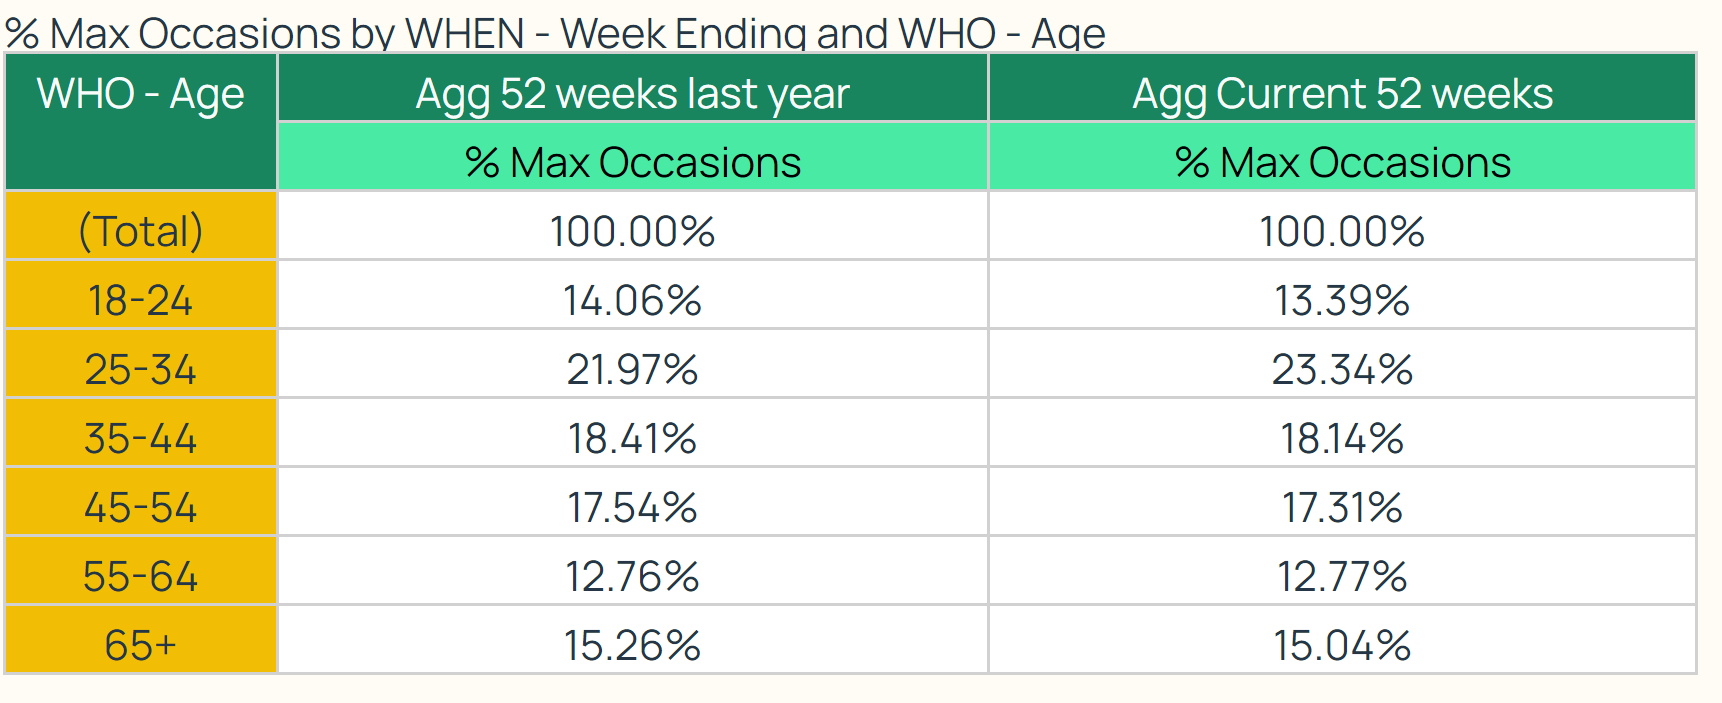
You can pull out core demographic information to build up an overall picture of ‘who is the consumer’.
Example: Is there a specific age group that is driving the increase or loss of share in that category?
Dimension to use: WHO – Age


Regionality
We ask survey respondents where they are based meaning the regional lens can be used to compare metrics such as participation, food and drink preferences or behaviours across the country.
Example: Is the South-East consumer more engaged in your category compared to the average UK consumer?
Dimension to use: WHO – Region
Psychographics, Attitudes, Beliefs, Behaviours
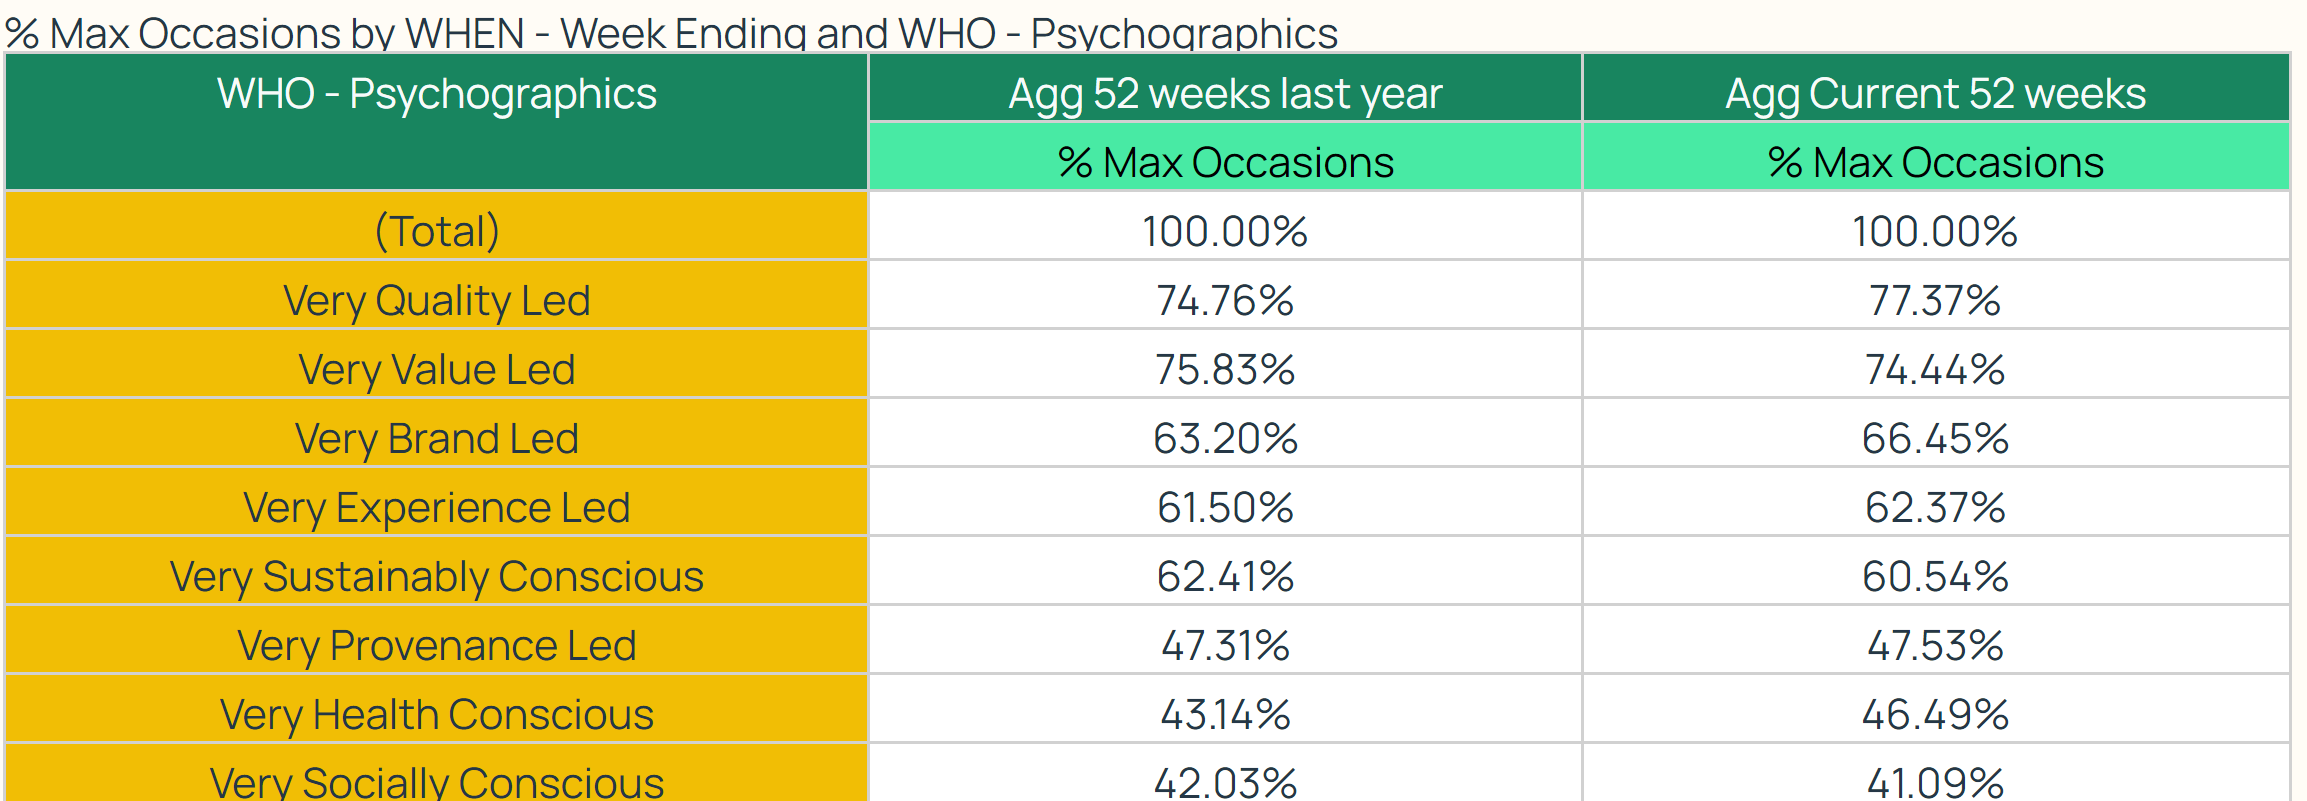
We ask respondents a series of questions to determine which factors drive their decision making to understand if they are brand led, value led, health led etc. We also ask about their attitudes towards certain considerations such as healthy eating, sticking to a particular brand, or trying out new things.
Example: If the average consumer is becoming more quality led, what impact has this had on your category?
Dimension to use: WHO – Psychographics


Step 3: Why
We ask a range of questions about why consumers engaged with the out of home or convenience market.
Reasons and Occasions
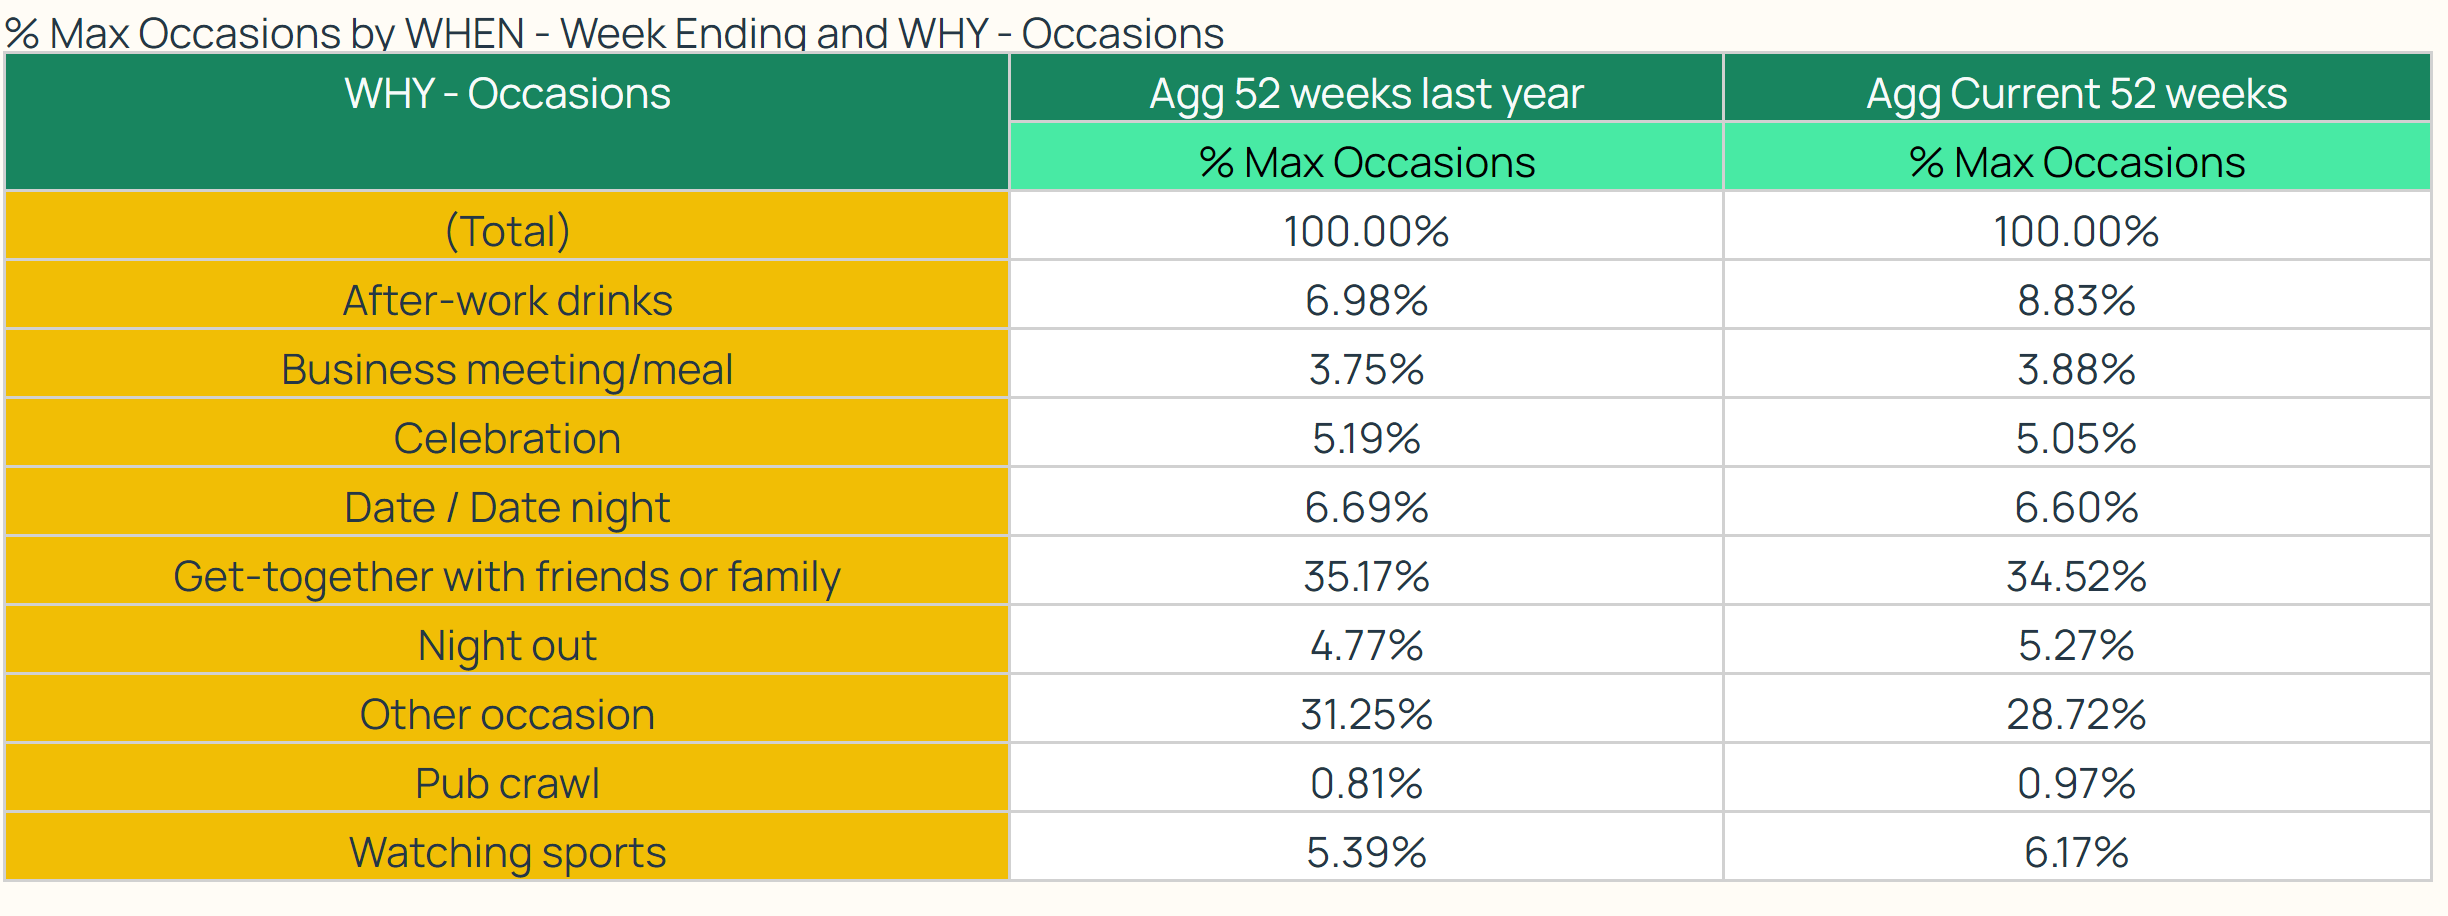
In the Eating & Drinking Out data we can uncover the reasons why consumers decided to eat out, what kind of an occasion it was, what they consumed and the motivations behind their choices.
Example: How are consumer habits and routines changing and is this having an impact on your category?
Eating & Drinking Out Panel Dimension to use: WHY – Occasions


Reasons, Missions and Drivers to Store
In the Convenience data we can find the reasons behind store preferences and core decision drivers for consumer purchases (both planned and impulse-led).
Example: Have loyalty offers or engaging in-store activations enticed consumers to purchase new categories or brands?
Convenience Tracking Programme Dimension to use: WHY – Reason for Impulse Purchase


We hope you have found these suggestions on where to start looking for answers in the data helpful. Look out for more blog posts on other useful ways to answer key business questions. As usual, if you have any questions or comments, please reach out to your Customer Success Manager!
Sources: Eating and Drinking Out Panel and Convenience Tracking Programme

