As part of our commitment to continuous improvement, we recently refreshed our Category Strategy Tool to make our data more visual, dynamic, and insight led. This is now accessible to all Convenience Tracking Panel licence holders in the data portal through the My Dashboards button at https://insights.lumina-intelligence.com/
During our Q3 Convenience Insights Academy we explored how to best utilise this new dashboard to answer common business questions and quickly build a winning category story.
In this post we reveal the top 10 ways to use our Category Strategy Tool, turning data into clear, actionable insight to unlock your next big opportunity.
1. Shopper Mission Mix
The Lumina missions help to uncover why shoppers buy into to your category by asking respondents about the main reason for visiting a convenience store. For example, we can find out if shoppers were looking for something to eat or drink on-the go, or if they needed to buy something they had run out of.
Our Mission ranking mini-tab demonstrates mission share over a 52-week period, plus percentage point change and index against the Total Convenience average.
Align with shopper needs, sharpen your strategy and work with retailers to influence those core KPIs of penetration, frequency and spend. Understanding which missions drive growth allows you to tailor range, pricing and messaging to make your category the go-to choice every time.
2. Advanced Mission Forecasting Analytics
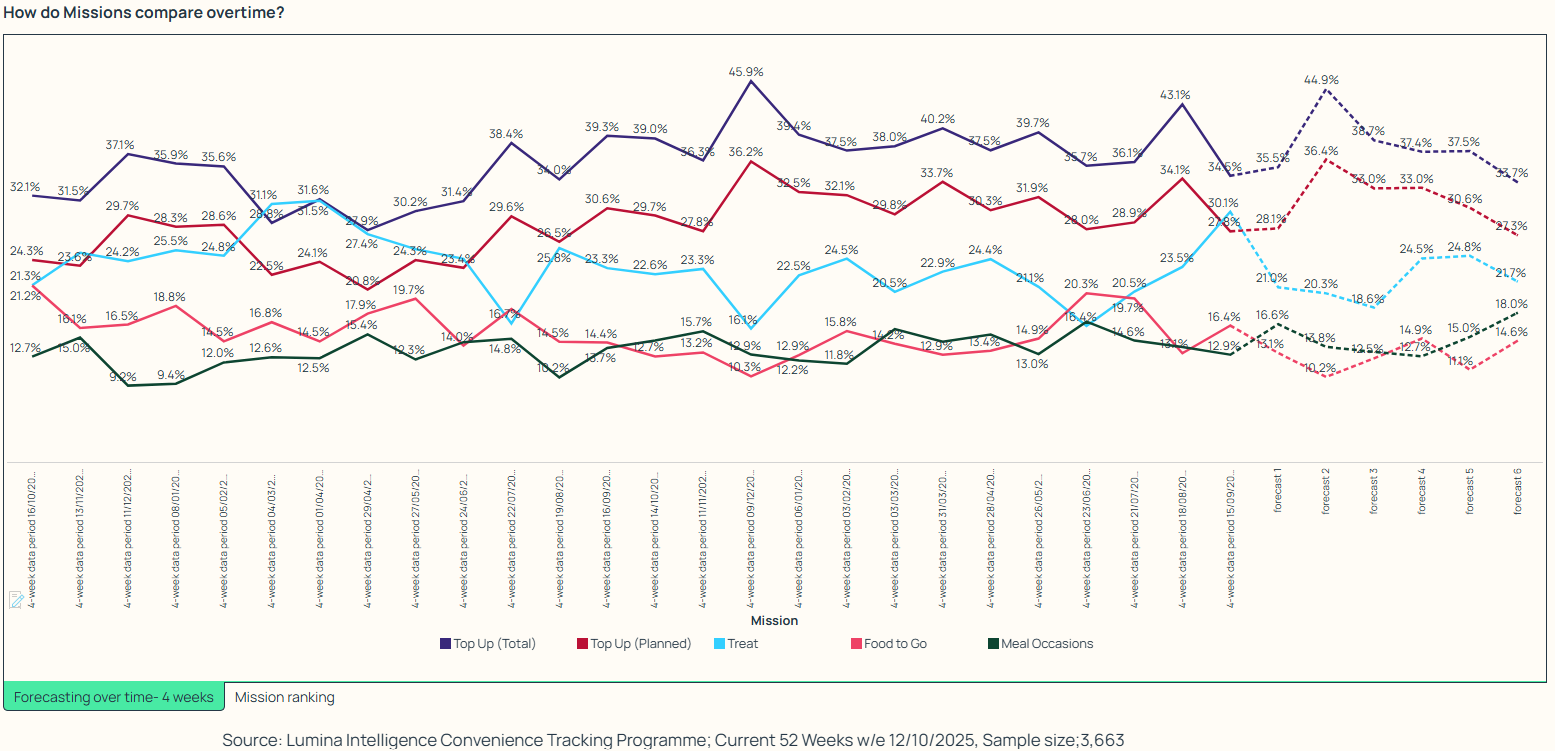
Our brand-new forecasting feature uses the Holts-Winters model to project future performance of each mission in the selected category and channel.
For example, where the share of Total Top Up Mission in Confectionery is forecasted to grow, we can observe that this is mostly driven by Planned Top-Ups, meanwhile Distress Top Ups are forecasted to remain consistent.
In Managed Convenience, Meal Occasions are predicted to grow for those with Confectionery in their baskets, highlighting a clear opportunity to integrate the category more closely with meal solutions, either through meal deals, placement in store or joint brand activations.


3. Demographics Targeting
Our most popular visual has been included in the tool to demonstrate who is buying into your category. Combining average income vs age, the size and position of the bubbles reveal category penetration by demographic. Use this data to target the right shopper and tailor new product development according to Retailer and Mission.
Further cross-category opportunities can be uncovered by selecting multiple categories or products in the primary filter drop down.
4. What-If Scenario & Size of the Prize
The “What-if” Tool turns analysis into action and insight into influence. Uncover your estimated annual category value using our top three data KPIs: penetration, frequency and average spend.
Reveal your potential annual category value at the click of a button, then use the levers on the right-hand side to model the impact of a changing market in real time.
By quantifying your opportunities and demonstrating value in simple numerical terms you can easily elevate commercial conversations and drive smarter, quicker decisions.
5. The Shopper Journey: Path to Purchase
Understanding where and why conversion happens along the path to purchase highlights key moments to engage and influence the shopper journey.
We can answer questions such as: Which location in store are Crisp & Snacks shoppers purchasing from? What is the main occasion this category is purchased for? Are Crisp & Snack shoppers more influenced by brand, price or pack size?
By switching on the Mission filter, we can drill down even deeper into core shopper decisions. Where price is more important than brand for those shoppers on a Treat Mission, your category strategy will need to focus on clear value communication, solution-based messaging and targeted treat-led mechanics.


6. Impulse vs Promotion
These are both pivotal reasons for conversion in the path to purchase and highlight the benefits of intercepting and influencing the shopper at critical decision points.
Some shoppers may not have intended to buy into the category but were prompted to purchase on impulse. Alternatively, shoppers may have been encouraged by promotional mechanics such as loyalty incentives, bundled offers or percentage discounts.
Where promotional shoppers are spending more on your category YoY, how can you work with your retailer to participate in loyalty or reward campaigns to tap into this?
7. Category Key Drivers
Identifying which factors are most likely to impact spend and how this differs by category is key to informing your category positioning. Our visual chart maps the factors that influence spend on category and adding the Mission and Retailer filter will further illuminate how strategy can be tailored to shopper needs.
The Category Ratings are key to understanding where your category over or under performs, according to shopper priorities. Understanding these strengths and gaps is essential for joint business planning, providing the evidence needed to shape conversations about range, displays or product communications strategies.
8. Cross Shop Basket Analysis
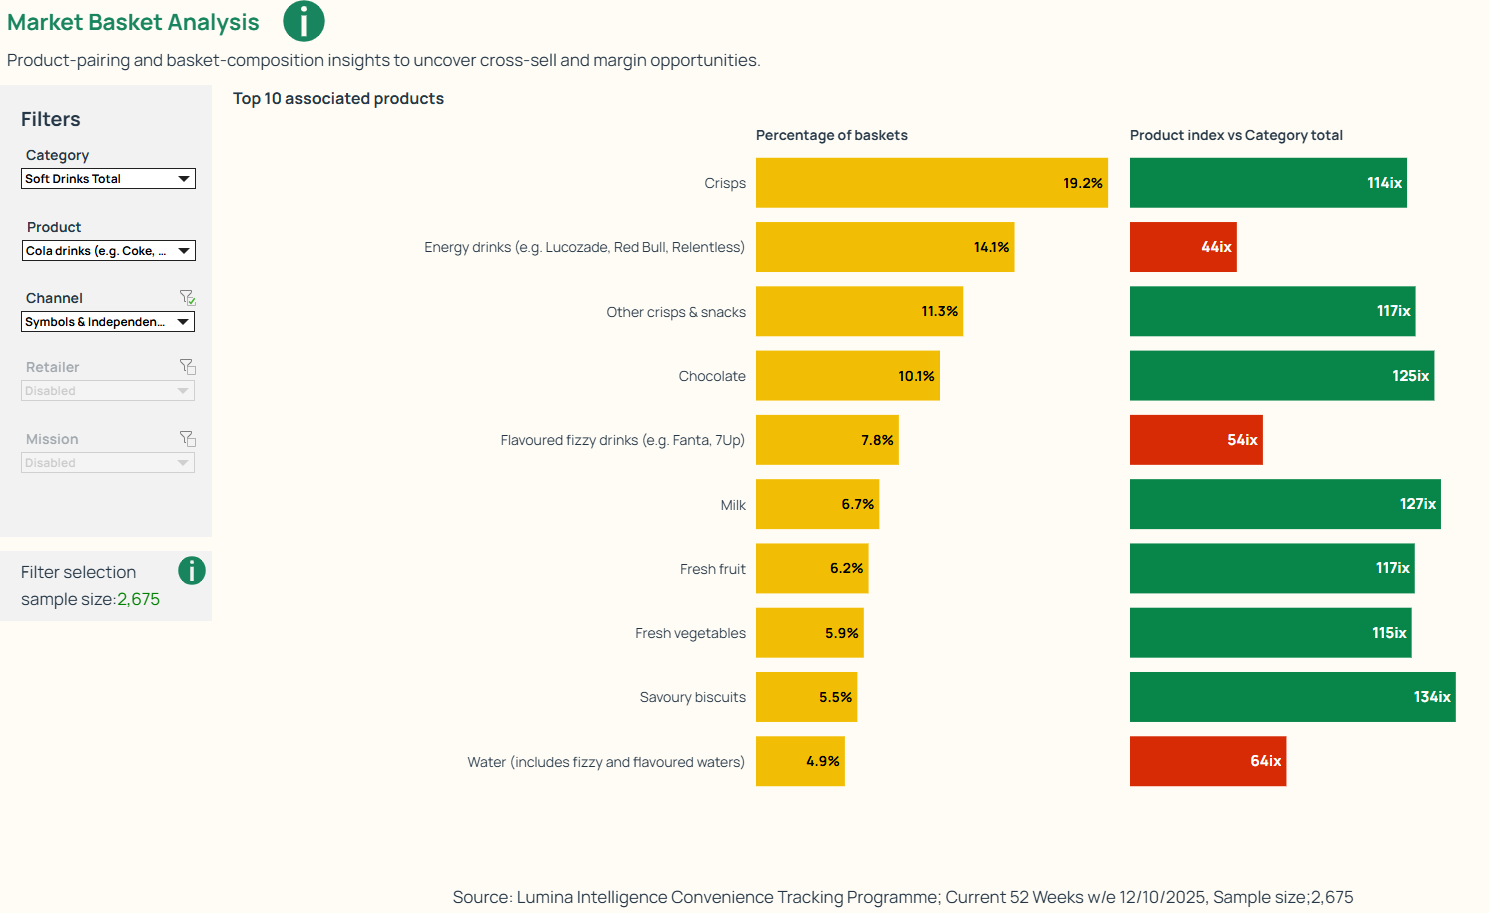
Looking at basket analysis is key to understanding associations between different categories or products. Our visual chart demonstrates the top 10 associated products, their basket share, and how they index against the Total Convenience. You can also dig into more detail using the Channel, Retailer and Mission filters.
Looking at basket composition and product pairings is the most effective way to uncover cross-sell and margin opportunities. You can also increase your category value by combining these insights to plan cross-promotions and secondary placements to encourage basket size and spend.


9. Product Index vs Category Average
This feature of the tool allows users to see which products are over-represented in certain baskets, diving into more detail by Channel, Retailer and Mission.
Data at this granular level is essential for joint business planning meetings, helping you to build persuasive narratives with retailers and stakeholders, tailoring campaigns and mission-led shopper activations.
For example, when Cola drinks are purchased in Symbols & Independents, chocolate over-indexes compared to the total confectionery category. This indicates a strong treat mission and a clear opportunity for cross-merchandising.
10. Consumer Brand Preferences
While we can discover if brand is an important factor when purchasing into the category, we can also drill down into which brands are most popular at a product level. Our quick reference drop down shows the top three most popular brands and their percentage share.
Used alongside the basket composition data, these brand preferences help to identify marketing or brand partnership opportunities.
Bringing It All Together
Each feature of the Category Strategy Tool brings unique value to your category story, but by bringing them together you can create stronger, insight-led narratives to drive growth and stay ahead of market trends.
We hope you have found these points useful and look forward to sharing more useful tips and tricks soon. As usual, if you have any questions or comments, please reach out to your Customer Success Manager!

