Published April 2019. Are consumers engaging with clean label claims in sports nutrition?
This report, which forms the first part of the clean label series, gives an overview of the market and analyses the development of clean label claims in sports nutrition (SN), in protein powders, protein bars, branched chain amino acids (BCAAs), pre-workout blends, nitric oxide boosters and creatine supplements.
€900
What this report gives you:
- Analysis based on the research of best selling products in online retail channels across 20 countries in Q3 2018.
- Relation of online engagement (2.4 million post-purchase customer reviews and product scores) with ingredients and claims on pack to highlight customer satisfaction.
- The current picture for clean label in sports nutrition. How many products make a clean label claim? How many brands have a clean label product in their portfolios? How does clean label affect price points in different countries?
- Data split by audience including how brands are using clean label claims when targeting broad or specialised audiences and what impact this has on consumer engagement and price.
- Individual clean label detail. What claims resonate most with consumers? How do these measure up to products with no clean label claims?
- Up-and-coming trends and recommendations for companies looking to capitalise on these in the future.
Quick facts:
- 24% of sports nutrition products make a clean label claim, with 6% of them in fact having more than 3. Consumers are concerned about the contents of their food, and are pushing industry to increase label transparency to do this.
- Canada, the USA and Australia are the top countries by percentage of products on market with clean label claims in SN, with the trend increasingly resonating with Asian consumers.
- The top brand for specialised clean label products is Optimum Nutrition, with 231k reviews followed by MusclePharm (116k) and Myprotein (82k).
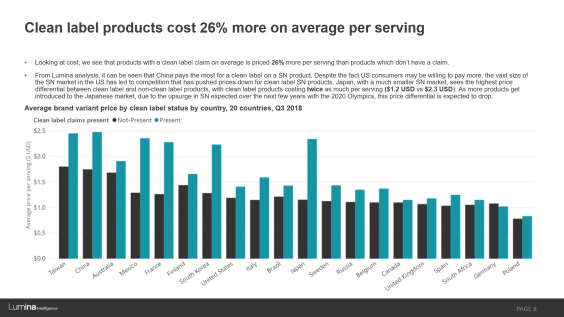
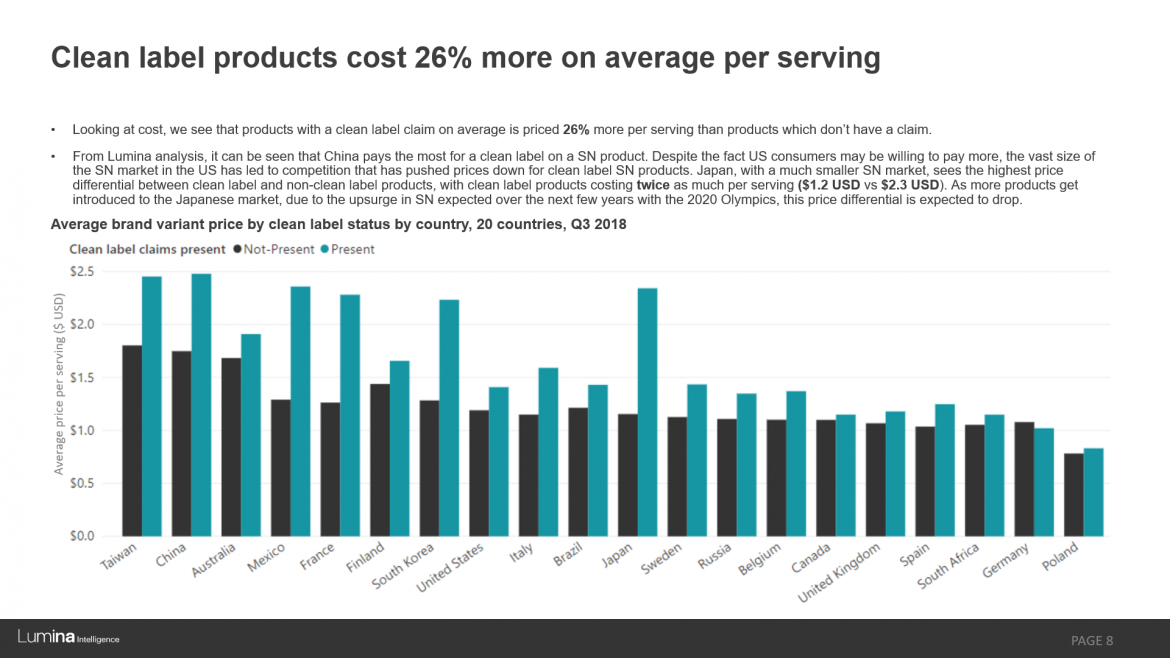
- Clean label products are priced on average 26% more per serving than products which don’t make a claim. In specific countries this is even more pronounced – for example in Japan, where clean label sports nutrition products cost twice as much as their non-clean label counterparts.
Preview – 2 slides of 33:
Chapters
- Clean Label Overview
- Split: General Audience Vs Specialised Clean Labels
- Individual Clean Label Detail
- Up-and-Coming Trends
- Conclusions and Recommendations
Got questions about the sports nutrition market?
We examine the key players, trends and target consumers in 20 countries, as well as explore how Lumina can help you form a fact-based business or NPD strategy.


