Lumina Intelligence has now released our Sports Nutrition March 2019 Market Data, available to our subscribers for download from Product Data on the Lumina Intelligence platform. The new data has shed light on an increasing number of parallels between consumer engagement and product success. Here we summarise some key findings, including the link between reviews per capita and number of products being removed from the market in that country.
Review Growth
There was an overall growth in review numbers of 15% between September 2018 and March 2019. The largest growth was seen in Mexico (+200%), Taiwan (+193%) and Finland (+93%). The Mexican and Taiwanese markets were relatively small at initial data collection, so growth rates are more pronounced.
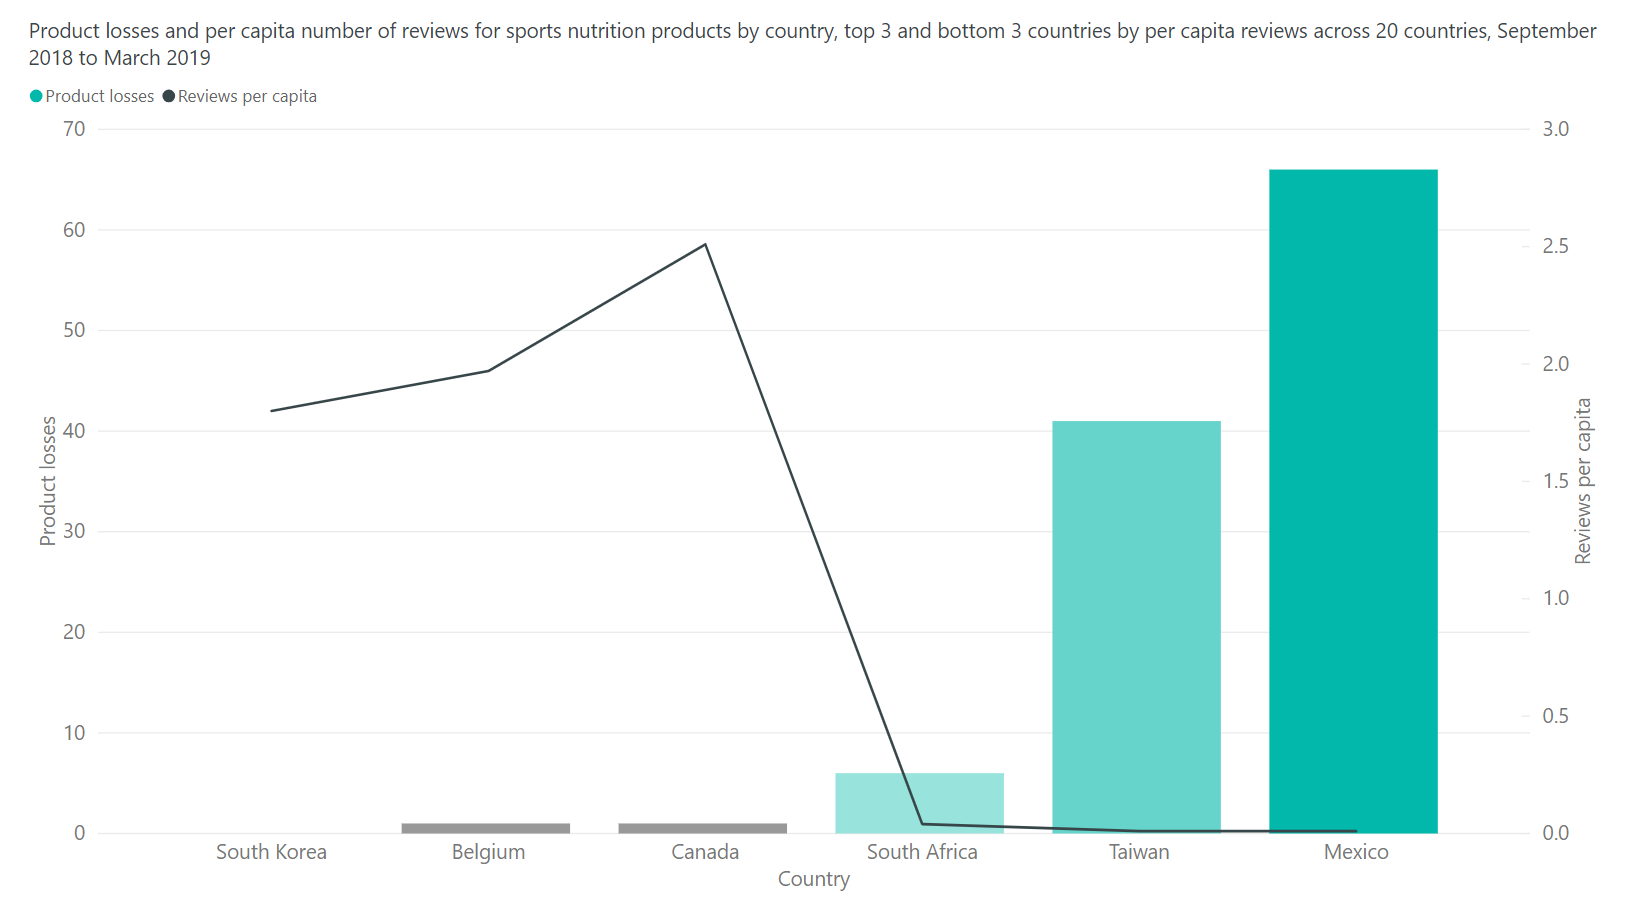
Per capita reviews linked to product losses
6.7% of products captured in September 2018 are no longer available as of March 2019.
The new data revealed that countries with the highest reviews per capita as of September 2018 experienced the lowest number of retracted products in the six months that followed. This also rang true on the opposite end of the scale – countries with the lowest reviews per capita experienced the highest amount of product losses.
Importantly, two of the countries with the lowest reviews per capita in September 2018 (Mexico and Taiwan) had the highest growth in reviews between September 2018 and March 2019.
With this, it begins to indicate a relationship between reviews and product withdrawals. As existing research suggests a link between reviews, product star ratings and sales, this does not come as surprising.
High-growth areas: Protein powder and pre-workout blends
In terms of product types, protein powders and pre-workout blends have seen the largest growth in review numbers during this period.
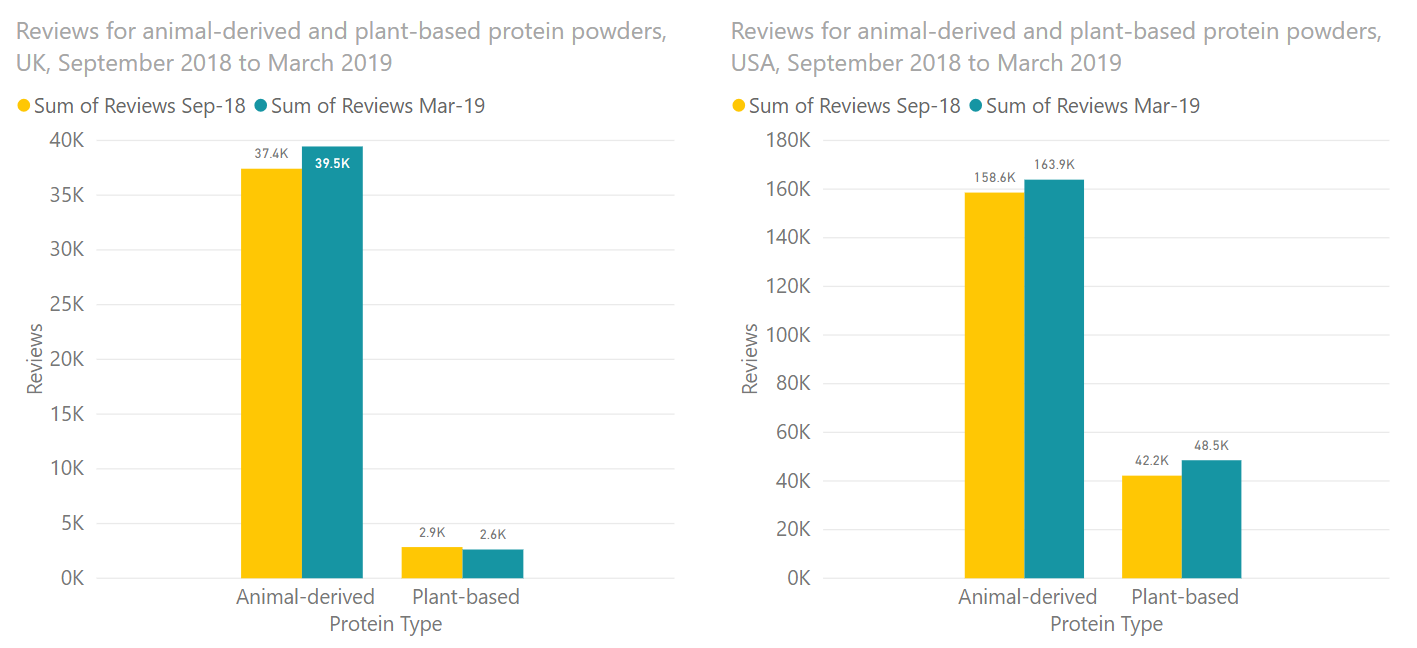
Reviews for protein powders increased by 23% between September 2018 and March 2019. In protein powders there was parity in review growth between plant-based and animal-derived protein powders, at 11%, but this number is highly dependent on country. For example, in the US plant protein have seen a +17% growth in reviews, versus animal protein’s +3% growth. In the UK this was reversed, with reviews for animal protein-based powders growing by 6% while reviews for plant-based protein powders decreased by 8% – most of this due to reviews being removed from Amazon.
Following, reviews for pre-workout blends increased by 22%. Once considered a niche only for the gym-going hardcore, pre-workout blends are now showing potential for expansion toward energy drinks and non-powder formats. One third of sports nutrition brands count PWBs in their ranges, with 11 out of the top 20 most reviewed brands selling PWB products.
Sports Nutrition March 2019 Scope
- 6 researched product categories: protein powders, protein bars, BCAAs, pre-workout blends, nitric oxide boosters and creatine supplements
- 20 countries: Asia Pacific (Australia, China, Japan, South Korea, Taiwan), Europe (Belgium, Finland, France, Germany, Italy, Poland, Russia, Spain, Sweden, United Kingdom), Americas (Canada, Brazil, Mexico, United States), and MEA (South Africa)
- 2566 distinct brand variants were captured, incorporating 743 brands and 633 brand owners.
- Additional data breakdowns by product details, ingredients, claims and nutritionals.
- Health benefits: 50
- Free from: 12 claim types
- Clean label: 28 claim types
- Ethical label: 15 claim types
If you are an existing subscriber to Lumina Intelligence Sports Nutrition you can log in here and view the new data.
View all our reports
See the range of reports we offer for the sports nutrition market including market overviews, deeper examinations of niche markets, country insights and more.


